The Gantt Chart for Innovation

What is a Gantt Chart for Innovation?
A Gantt Chart for innovation is a map by which a company can navigate risks in order to pursue large potential financial returns on new products. The phrase “Gantt Chart for innovation” refers to the famous Gantt Chart, used by product managers everywhere to manage projects from conception to completion.
Without such an artifact, companies too often struggle against the same old barriers, Unable to push forward or even to drop their hopeless initiatives.
I love the way Astor Teller, head of Google X, put it in his TED talk: “We spend most of our time trying to prove we’re wrong. We cheer… ‘Hey, how are we going to kill our project today?!’” Does this describe breakthrough B2B innovation at your company? Or is the following more familiar:
- The landmines that blew up past projects could have been recognized earlier.
- We work on the “easy stuff” before addressing the toughest issues.
- Nobody wants to tell management the project should be stopped.
- We shy away from transformational innovation due to past failures.
The Case for the Gant Chart for Innovation: Begin with Risk
At the root of the problem is this: Many business leaders consider high-stakes projects to be “risky” when they should simply treat them as “uncertain.” In order to assess risk, you must be able to assign a probability of a negative outcome. When you start a transformational project, you don’t have this information. You’re simply uncertain.
Your job is to learn as early and cheaply as possible.
Is this just semantics? Far from it. When facing uncertainty, your job is to learn as early and cheaply as possible. It’s not about bravado, gambling, or fear of broken promises. It’s about learning intelligently. Here’s how to do this in a repeatable fashion that lets you become bolder and safer at the same time. Note the following steps to produce the Gantt Chart for innovation.
Step 1: Diverge to a broad range of assumptions
Imagine your company makes composites for wood decking, and someone has this bright idea: “Maybe the shipping cartons used by Amazon and others could be made out of our recycled plastic and wood fibers. Just think: better water resistance, stacking strength, and abrasion resistance, right?”
Your project team begins by brainstorming as many possible assumptions as possible. These should be phrased as, “For our project to succeed, it must be true that…”

When your team can’t think of any more assumptions, create a consumption chain. Critical to understand for true B2B innovation. This is a step-by-step map showing how customers interact with a product: select, order, receive, use, maintain, and so on. This will generate fresh assumptions you missed earlier.
Risk Management is a key part of the NPD process. To learn the other 11 critical steps, click here.
Then put all assumptions into one of three buckets: Market Dynamics, Internal Capabilities, and Customer Outcomes. In the graphic shown here, these are yellow, green and blue sticky notes, respectively.
Step 2: Converge to those assumptions that matter
Now it’s time for your team to rate each assumption for impact and certainty. For impact, the scale ranges from “irrelevant” to “required.” For certainty, the choices range from “unknown” to “certain.” We like to have each team member first vote independently using a web-based app. Then a facilitator guides the team to a single rating.
The final team rating must not be a consensus where the majority rules. After discussion among team members, the final rating is whatever the most cautious team member is comfortable with. So if one team member thinks a assumption has higher impact or lower certainty than the other team members… his or her rating is used. The path to the Gantt Chart for innovation is beginning to form.
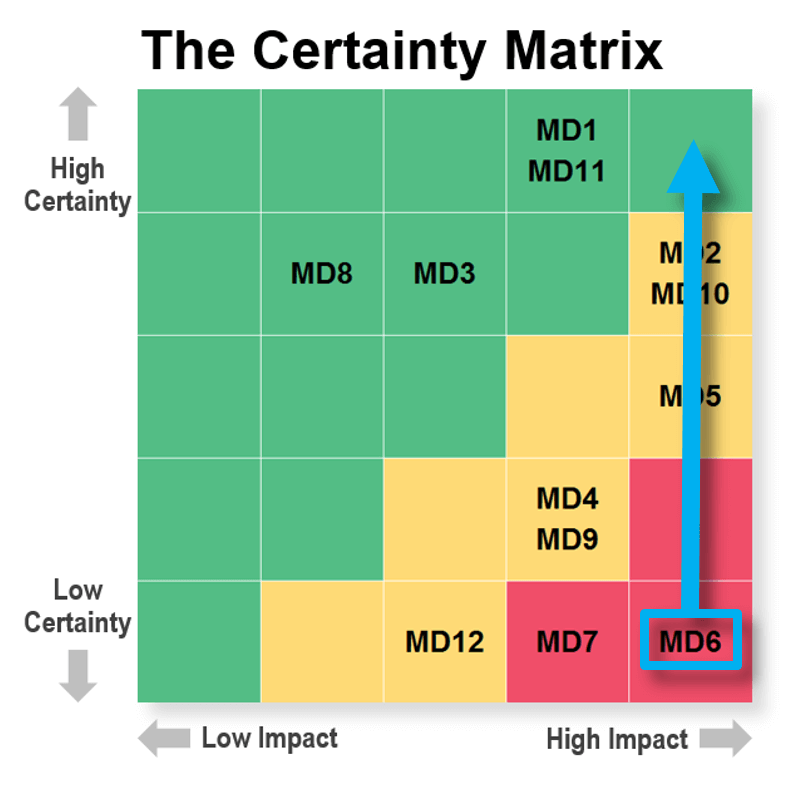
However, you may ask, “why so cautious?” We use Minesweeper® software to place each assumption on the Certainty Matrix shown. Those falling into the red (danger) or yellow (caution) zones will be further investigated. And hopefully, the team will learn enough to move them into the green (safe) zone later. But if a team unwisely places an assumption in the green zone at the onset, they won’t investigate further and could get a nasty surprise later.
Step 3: Investigate with a CheckPoint Plan
Any assumption in the red or yellow zone is investigated by the team. It assembles a CheckPoint Plan that details “who does what by when.” Typical activities assigned here include…
- purchasing secondary market research
- conducting interviews with potential customers
- working with industry experts
- running preliminary lab experiments
Most of these activities can be done rapidly and inexpensively. If some require more investment, save them until you have quickly “cleared out” the other assumption. In most cases, your team will move a red or yellow assumption “up” on the previous chart (from uncertainty to certainty). But in some cases, you’ll learn that what originally seemed to be “high impact” was not.
Step 4: Intelligently communicate progress to management
Your team needs a “Gantt chart for innovation to manage risk.”
Here’s the part most teams get wrong. Their progress reports to management are not comprehensive, and they do not boost confidence. The teams “zoom in” on some assumptions like a randomly-operated microscope, but they fail to show the big picture. Management senses this and asks, “But what about this?… and did you think about that?”
Contrast that to a 500-line Gantt chart used to guide a big project: Management asks if you’ve remembered three activities, and you say, “Sure, as you can see, these are covered on lines 146, 342, and 428.” Does this boost management confidence? You bet it does.
Just as a Gantt chart manages project data. Your B2B innovation team needs a “Gantt chart for innovation to manage risk.” This is what the Project Risk Profile (also from Minesweeper software) does, as shown here.
At a glance, management can see where the major assumptions lie that still need to be investigated:
- Market Dynamics: those risks common to anyone trying to pursue this market segment
- Required Outcomes: end results customers now receive and must continue receiving
- Desired Outcomes: end results customers would like to begin receiving
- Internal Capabilities: competencies our company must have to succeed.
- Required Solutions: our company’s ability to deliver Required Outcomes
- Desired Solutions: our company’s ability to deliver Desired Outcomes
You must delivery all Required Solutions and at least one Desired Solution.
A quick note on the last two: To succeed in this market, you must deliver all Required Solutions and at least one Desired Solution. Fail in the last part, and you’ll enter a “red ocean” with a me-too product… and predictably disappointing results.
Learning More about creating a “Gantt Chart for Innovation” with Minesweeper
To be clear, the term “Gantt Chart for Innovation” is really a metaphor. The normal Gantt Chart provides a core artifact, one at the heart of a robust process, to manage projects. Whereas, Minesweeper and the de-risking process likewise provide the “Gantt Chart for Innovation” as an artifact. And also one that is built upon a proven and robust methodology. I hope this process sounds simple… because it really is. It’s all about carefully planning your work before rushing into it.
We find that in just a day or two, a project team can get a wonderful grip on its assumptions, with a clear plan to knock them down one by one. Just as important, they can now intelligently discuss their risk-reduction plan with management. For more on how this works, check out our video here. We’re also happy to give you a free demonstration of Minesweeper software, which is now available as an “upgrade” to Blueprinter 5.0 cloud-based software. Just contact us.
Click here to learn more about Minesweeper: AIM’s de-risking methodology
Comments