VoC Customer Interviews — By the Numbers

If your new product development teams aren’t routinely conducting quantitative VoC customer interviews, you’re squandering R&D resources. I say this for two reasons: First, studies show the average company wastes 25-50% of its R&D spending on new product failures (generally something the customer never wanted). Second, our experience at AIM shows that clients are usually surprised by the results of quantitative customer interviews. Said another way, they would have developed a different product without this explicit direction from customers.
Qualitative vs. Quantitative VoC Customer Interviews
It’s common for 6-10 market segment-focused qualitative interviews to give you scores of desired customer “outcomes” or end results…which are typically reduced to a “top ten” list. During quantitative—or Preference Interviews —you ask two key questions: 1) How important is this outcome to you, and 2) How satisfied are you with it today? You record a 1-10 customer response… with 10 being “critically important” for the first question, and 10 being “totally satisfied” for the second. Of course, you’re hoping to find some outcomes that score very high in importance and very low in current satisfaction. That would be an outcome you could sink your R&D teeth into with confidence.
Click here to learn more about Market Segmentation using Blueprinting
VoC Customer Interviews can Yield Quant Data
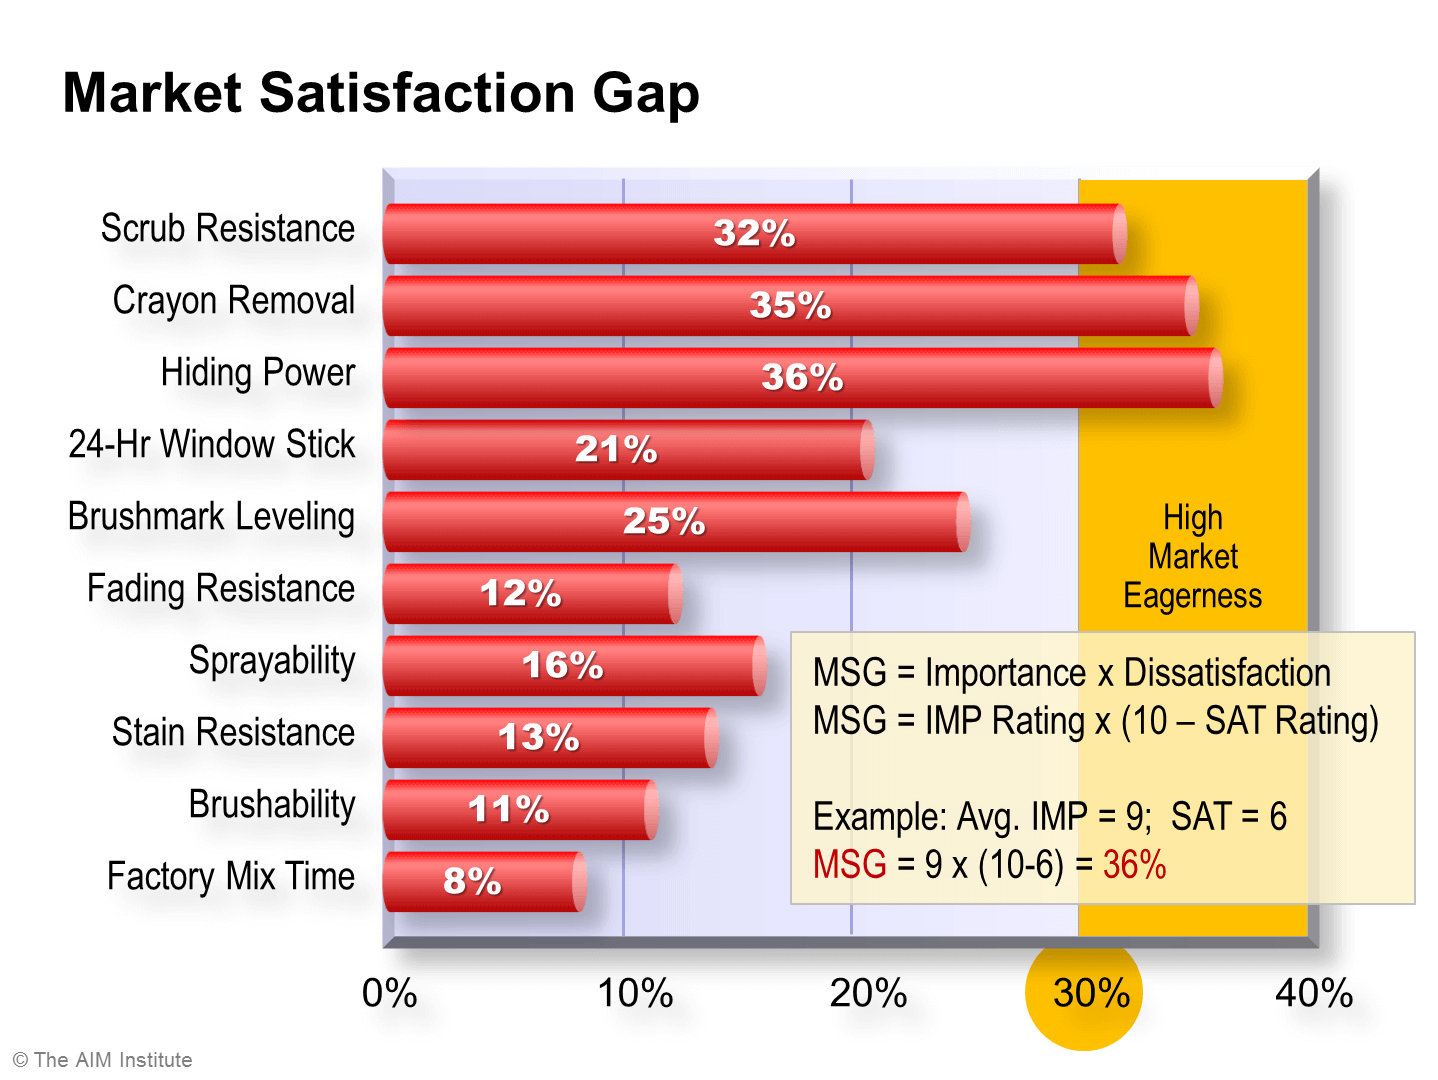
I developed a simple algorithm years ago that combines the answers to the above two questions. It’s called the Market Satisfaction Gap (MSG). If IMP is customers’ average 1-10 score on the first question, and SAT is their 1-10 score on the second, the formula looks like this:
MSG = IMP x (10 – SAT)
So the more important the outcome is to customers—and the less satisfied they are today with this outcome—the higher the Market Satisfaction Gap. If you supplied resins to paint producers, your Market Satisfaction Gap profile might look like this:
Interpreting the Market Satisfaction Gap
A market segment is eager for improvement in any outcome with an MSG above 30%.
VoC customer interviews, in the form of quantitative “Preference” interviews provides the data. And here’s where it gets fun: Our experience shows that a market segment is eager for improvement in any outcome with an MSG above 30%. In the above chart, paint producers would like a resin that helped them with hiding power, crayon removal and scrub resistance.
Every MSG profile tells a story. If your product development team gets a profile in which the highest gap is 15%, your question should be, “What other market segments do you want to pursue?” Because this market segment is over-served. They’re happy with everything they’ve already got… except a lower price, of course. We’ve seen other market segments in which every single outcome scored in the 30s, 40s or 50s. These segments were screaming for help!
We’ve worked with hundreds of teams, executing thousands of VoC customer interviews, in countless B2B industries, and here’s what we see: It’s rare for a team to look at its Market Satisfaction Gap chart and not be surprised. (Check out this research report on the results of many projects.) In many cases, an outcome the supplier was excited about scores very low with customers. It’s hard for suppliers to see their lovely theory attacked by a brutal gang of facts. The only thing harder would be to spend a million dollars developing a product… which is then attacked by a brutal gang of facts.
In many other cases, an outcome suppliers thought to be of low interest—or wasn’t even on their radar screen prior to interviewing—actually has the highest MSG. Having this hard data gives you the confidence to enter the costly product development stage with gusto. Ideally your competitors will continue to squander their resources on what they—and not their customers—want developed. And you’ll know what customers want, so you can tightly focus your R&D resources on pleasing them.
To learn more, check out this video on the value of “customer surprises.” Or to go deeper download Chapter 14 at New Product Blueprinting Chapter Downloads.
Comments