Beyond the Vitality Index: Two Metrics to Truly Assess Innovation Potential

Peter Drucker said, “If you can’t measure it, you can’t improve it.” So what’s the “it”? Consider another Drucker quote, “The business enterprise has two—and only two—basic functions: marketing and innovation. All the rest are costs.” It’s not hard to imagine this great management thinker wanted us to measure innovation. How do you measure new product innovation? Most use a metric developed by 3M in 1988 called the Vitality Index.
One of its attractions is simplicity: new product revenues as a percent of total revenues. “New” products are those introduced in the last five years (or sometimes three years.)
Is it time to apply innovation to how you measure innovation?
Should you keep using the Vitality Index? Absolutely. Should you stop relying solely on this three-decades-old metric? Is it time to apply innovation to how you measure innovation? You bet. Let’s see why.
3 Shortcomings of the Vitality Index
Don’t supplant your Vitality Index… just supplement it. The Vitality Index is helpful, but doesn’t “measure up” in three areas:
Not predictive: The Vitality Index is a lagging indicator, only telling you what already happened. It leaves you clueless as to what will happen next. That would require a leading indicator.
Not prescriptive: It doesn’t suggest how to improve. Want an impressive stream of highly-differentiated new products? Good luck getting any help from this metric.
Not precise: It’s famously easy to manipulate. Want to call your product “new” because you changed its color… its packaging… or just its name? You won’t be the first.
Imagine you were going to introduce new industry metrics for measuring innovation and ensuing growth. What criteria would you use? I’d look for four things:
- Leading Indicator: “If we do more of this, it will result in rapid, profitable, sustainable growth from our market-facing innovation.”
- Actionable: “If we make specific activities a high priority, our employees will be able to implement them.”
- Benchmarkable: “We can easily compare our performance on this year over year… and against other companies.”
- High impact: “If we improve these things, it will significantly boost the rate and quality of our growth.”
I believe two new metrics satisfy these criteria: The Growth Driver Index (GDI), and the Commercial Confidence Index (CCI). The first measures your growth capabilities, and the second your unfiltered customer insight.
Growth Driver Index (GDI)
I’d like you to imagine this: You are a decathlete, scheduled to compete in quarterly track and field competitions leading up to the Olympics in four years. You can prepare using either Plan A or Plan B. In Plan A, you and your coach adhere to a regimen aimed at improving your capabilities. Your progress on maximal oxygen uptake, strength training, sprint times, etc. is closely monitored, with ongoing adjustments made to your program. In Plan B, you show up for each quarterly competition, try really, really hard, and hope for the best. You even have meetings with your coach, who reviews your last event’s results and insists you do better next time.
Click here to learn more about the GDI in the whitepaper, “What Drives B2B Organic Growth?”
Does Plan B sound a bit silly? So are you using Plan A in your business today? Do you know…
- which capabilities drive growth the most?
- how to improve these critical capabilities?
- whether your capabilities have improved?
- how you compare to your competitors?
- how to quantitatively track your progress?
 is more precise than the Vitality Index")
If it cost nothing more than a couple hours of your time each year to answer these questions, would you do it? For years, we’ve been concerned with LADD (leadership attention deficit disorder) for looking past the current quarter to long-term growth. So we developed a free service called the B2B Growth Diagnostic. You can learn more (and even get started) by going to B2B Growth Diagnostic.
Here’s how it works: Your employees take an online survey to assess your business on 24 growth drivers. You receive a 20-page B2B Growth Diagnostic report, with your results benchmarked against our database of 4500+ respondents. A companion piece, What Drives B2B Organic Growth helps you interpret your results.
The report includes this chart, with your current position (red marker), average industry position (blue), top quartile (gold), and top decile (green). Your Growth Driver Index (GDI) is a composite of all 24 growth drivers and is shown at the top of the chart. You can run this diagnostic annually to plot a course for continually improving your growth capabilities (tools, training, people, processes, etc.) Certainly, the vitality index will still be a useful metric about the mix of new products. And additionally, the GDI will help you to understand your capabilities to increase that trajectory further.
Commercial Confidence Index (CCI)
Most new products fail for commercial—not technical—reasons. Technical risk typically drops during product development, but commercial risk often remains high all the way through launch. Companies figure out what customers want and don’t want by launching products at them.
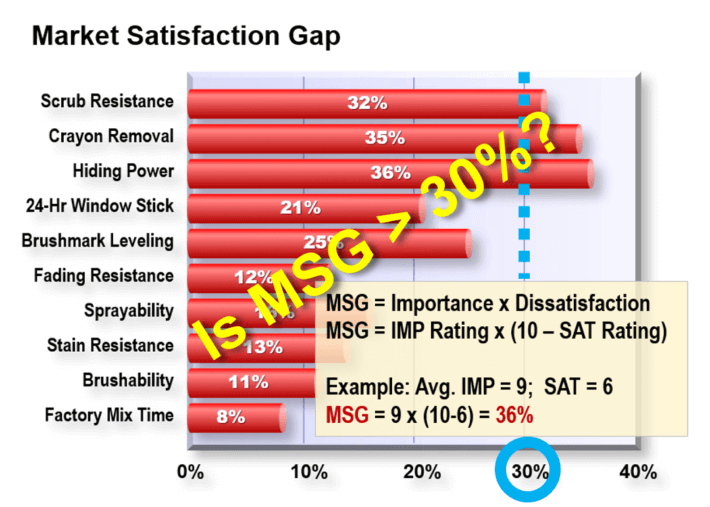
And yet with B2B customers—who have high knowledge, interest, objectivity and foresight—you can know what customers want in the front end of innovation. New Product Blueprinting practitioners interview customers, asking them to rate several outcomes on a 1-to-10 scale for both importance and satisfaction.
As shown in this chart, this generates a Market Satisfaction Gap for each customer outcome. Customers are only eager for improvement if the Gap is over 30%.
If you are developing a product based on Market Satisfaction Gap data (or something equally rigorous), we call this a “known-need” (KN) project. Everything else is a “guessed-need” (GN) project. The Commercial Confidence Index is simply your R&D spending on KN projects divided by your total R&D spending. A better future predictor of success than the vitality index, for sure.
Let’s try an example. Your R&D product development spending this year is $10 million. You have Market Satisfaction Gap data on four of these projects, each of which consumes $1 million of R&D. Your CCI is 40%. Can you imagine the dialogue that occurs when you first introduce this?
Comment: “But I have no idea what my CCI is!”
Response: “So you’re not sure if customers really want what you’re spending millions on?”
Comment: “OK, I’ve figured out my CCI now, but it’s… uhmm… zero.”
Response: “OK, but here’s my question: What will it be next year, and the year after?”
Comment: “This is going to take extra resources to figure out Market Satisfaction Gaps.”
Response: “Could you use some resources now being wasted when you guess customer needs?”
The Vitality Index Just Isn’t Enough
The Quality Wave and Productivity Wave crested decades ago, and we’re now in the Innovation Wave. (See Catch the Innovation Wave at AIM Whitepapers.) At some point, the “normal” approach to B2B innovation will look very, very different, including our metrics. Many companies will be surprised by these changes. Others will have seen the future, and seized competitive advantage years earlier.
If you want to be in this latter group, please check out our research report, What Drives B2B Organic Growth. Or reach out to contact us to discuss this more. In the last few years, we’ve learned enough that the future of B2B innovation is becoming quite clear, almost obvious. Your path to this future can be exciting, rewarding, and ever-so-measurable.
PS: A great way to “sample the future” is by attending one of our open workshops.
Comments