It’s Time for New Innovation Metrics

You’ve heard, “measure twice, cut once,” right? When it comes to market-facing innovation, most companies only measure after they’ve cut. They use the vitality index—a fine innovation metric developed by 3M in 1988 that’s simple to understand: percentage of gross revenue generated from products launched in the past three (or five) years.
But if this is your only metric, you’ve made a spectator sport out of improving innovation, when it should be a participant sport. This is a risk with any innovation metric, but it’s especially troubling in new product development… where your work in the front end of innovation can take years to produce meaningful revenue. It’s like turning up your thermostat and having the furnace come on next week.
It’s like turning up your thermostat and having the furnace come on next week.
Don’t supplant the vitality index, but rather supplement it… with new leading innovation metrics. Kudos to a metric that’s been going strong for decades and still has value. But now it’s time to bring innovation to how we measure innovation. In this paper you’ll learn…
- Three shortcomings of the vitality index
- Four rules for better metrics
- A new innovation metric for building growth capabilities
- A new innovation metric for achieving commercial confidence
Download white paper at www.newinnovationmetrics.com
1. Three shortcomings of the vitality index as an innovation metric
The lagging nature of the vitality index isn’t its only problem. This innovation metric suffers from three deficiencies: It is neither predictive, prescriptive, nor precise. Let’s examine each.
Not predictive: Because the vitality index is a lagging innovation metric, it only tells you what has already happened. It leaves you clueless as to what will happen next. There’s nothing wrong with looking in your rear-view mirror to see where you’ve been… unless you fail to also look through the windshield to see where you’re going.
And the look-back time horizon is so long. Imagine you are in the C-suite of a company using the five-year vitality index. There’s a better-than-50-50 chance you were in a different job when some of these “new” products were developed. And the same likelihood that your replacement will enjoy a vitality index boost from your current efforts.
If you rely solely on the vitality index, it can lead to reduced accountability. I know a VP-GM that told people he “didn’t believe in innovation.” Why? He was going to retire in a couple of years and knew innovation wouldn’t help his short-term bonuses.
This is a clear case of leadership larceny. But here’s the interesting part: This fellow had the chutzpah to say what some just quietly do. If you’re the CEO, how do you know your business leaders aren’t silently behaving this way? You need the right innovation metrics to rest easier.
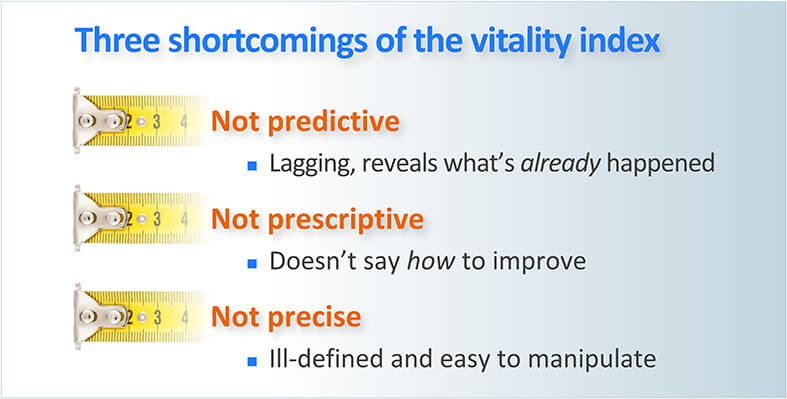
Not prescriptive: You want your new product revenue to increase from year to year, right? Does the vitality index tell you how to accomplish this? Not at all. Think of all the actions you could take to increase revenue from new products:
- Increase your R&D staffing levels
- Hire more marketing people
- Train your staff to better understand customer needs
- Improve the rigor of your gate reviews
- Spend more on your product launches
Unless you supplement your vitality index with other innovation metrics, you’re guessing which of these will work best. Imagine looking at three pedals on your car floor and guessing which will make you go faster. And then waiting years to learn if you were right.

Not precise: This isn’t the most serious problem, but it’s the one we hear repeated most often: “When is a new product really new?” If you change the product’s color, is it new? Is it a new product if it’s a knock-off of a product your competitors already offer?
Yes, you should put rules in place to reduce “gaming” the vitality index. But also add a “sister” innovation metric… the profit vitality index to your revenue vitality index. In other words, track the percent of gross profits generated from products launched in the past three (or five) years.
It’s immaterial what a supplier thinks of its new product. All that matters is what customers think of it. If they see new value, they’ll pay a premium and you’ll see higher profit margins. If you’re truly innovating, your profit vitality index will be higher than your revenue vitality index. If that’s not the case, then your newer products are providing less differential value to customers than your older products.
If you’re truly innovating, your profit vitality index will be higher than your revenue vitality index.
Track both vitality indices and you’ll create a natural disincentive to call something “new” unless it brings new value to customers. If a business leader tries to game the vitality index by including low-value products, he or she will have to explain why customers aren’t impressed with these products.
2. Four rules for better innovation metrics
If you supplement the vitality index with new innovation metrics, how can you be sure they’ll be the right ones? For efficient and effective management, you want the fewest number of innovation metrics that give you the most insight. You want indices that follow four rules:
Leading: A good leading indicator says, “If we do more of this, we’ll get more of the results we want.” Let’s be clear about those results for an innovation metric: You want rapid, profitable, sustainable growth from market-facing innovation. So yes, a good leading metric should result in increasing vitality index levels. But more important, it should drive rapid, profitable, sustainable growth.
This distinction is important because poorly designed metrics lead to unintended consequences. (See Don’t Let Metrics Undermine Your Business, Harvard Business Review, Sept-Oct, 2019). For example, you could use a massive but inefficient Soviet-style buildup of R&D resources to generate more new products. Great: Your vitality index went up. But your inefficiencies also yielded a low R&D ROI and depressed profitability. You avoid this trap with the goal of rapid, profitable, sustainable growth.
Poorly designed metrics lead to unintended consequences.
Actionable: Great new-product innovation is a full-contact sport, a bit like rugby: Each team player knows what to do during the game… and what to get better at between games. Same with leading innovation metrics for innovation.
Some innovation metrics should tell your engineers, scientists, marketers, and sale professionals what they should do while their multi-functional team is developing a new product. And some should guide them between projects, to develop capabilities—skills, methods, and tools—to do it even better with future projects. In this white paper, we’ll recommend a new “during-game” metric and a new “between-game” metric… both highly actionable.
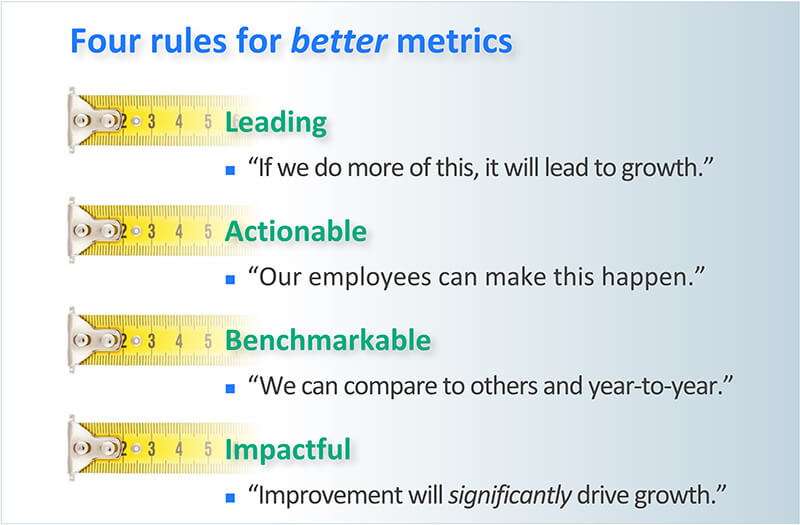
Benchmarkable: There are two ways to benchmark your performance, and you need both. First, any new innovation metric must allow you to compare your performance year-over-year. This is especially critical with one of the new metrics we’ll cover in this paper. Why? Because this metric will probably make your business look terrible at first. But that’s OK, because what matters is how you improve next year and the following year.
Second, it helps if your innovation metric lets you compare your performance against other companies. Can you imagine a world-class athlete that didn’t spend years competing and measuring herself against peers? Same for your leadership team: You need to see what top-quartile and top-decile performance looks like so you can aspire to this.
Impactful: Finally, any new metric must help you make a big difference in growth. There are many possible metrics that could distract you or dilute your attention. If you’re going to focus your organization on just a few leading metrics, you need the right ones.
How do you know if an innovation metric is high impact? In some cases, the “if-A-then-B” logic is so compelling that you can trust the metric. But in most cases, it’s best to have firmer evidence. It’s hard to prove causation in business results, since there are so many variables. But at least look for strong correlation between the leading indicator and the result you desire.
Now let’s look at those two new innovation metrics. The first helps your rugby team build the capabilities to win between matches. The second is a highly effective discipline to use in every rugby match.
3. A new metric for building growth capabilities
Years ago, in The 7 Habits of Highly Effective People, Stephen Covey said we need to balance Production (P) and Production Capabilities (PC). Getting out of balance leads to problems:
- Focus just on results (P) and you never get better.
- Focus just on capabilities (PC) and you never accomplish anything.
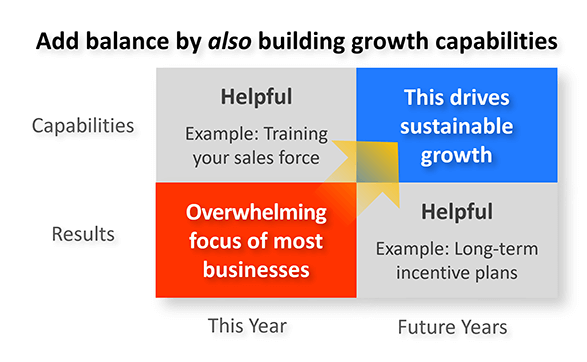
Many companies demonstrate a perilous obsession with current results. Business leaders focus on this year’s results and hit the “reset” button next year. They do it all over again and wonder why their results are not improving. Business leaders don’t have the luxury of ignoring current-year results, but they can rebalance their focus and spend more time building capabilities.
Business leaders focus on this year’s results and hit the “reset” button next year.
They need to spend more time in the upper-right quadrant below: building capabilities for long-term, reliable growth. This isn’t a binary choice, it’s a balance choice. Two good discussion questions for your leadership team are…
- How much are we focusing on building long-term capabilities today?
- Do we need to change our balance between results and capabilities?
Professional athletes understand the importance of building capabilities. Imagine your goal is to climb El Capitan, the 3000-foot granite monolith in Yosemite. You have two options. The first is to get the right climbing gear, start training at the local climbing gym, and begin a rigorous exercise program. Then month after month, keep building your capabilities.
The second option is to show up at El Capitan’s base every day and see if you can climb it. But make sure you try really hard, because you want… well… results. Ridiculous? Of course. It’s hard to imagine any endeavor—chess, golf, pole-vaulting—where champions didn’t first focus on building their capabilities. But many businesses? Easy to imagine.
So when you design your innovation metric, what capabilities should you focus on for rapid, profitable, sustainable growth? We asked 540 B2B professionals—with combined experience of more than 10,000 years—to rate 24 growth drivers in terms of importance and satisfaction with their capabilities. Some of these drivers help you understand customer needs, some help you meet them, and some do both.
The results showed a) B2B professionals were much more eager to improve capabilities for understanding customer needs, and b) those companies strongest at providing new-product value were much more capable in understanding customer needs. (Download this research report at www.whatdrivesb2borganicgrowth.com.)
Does this research tell you which growth capabilities you should focus on? No, your situation may be different. Ideally, you would benchmark your own capabilities on these same 24 growth drivers, before choosing which to work on. You’d let your employees rate each growth driver for your company’s current proficiency in it. You can do this using a free service at www.b2bgrowthdiagnostic.com.
After your employees finish their online survey ratings, you’ll receive a diagnostic report with the chart below. For each growth driver, you’ll see how employees rated your business’s current proficiency on a -3 to +3 scale. These endpoints are anchored by a description of what very poor and very good performance looks like.
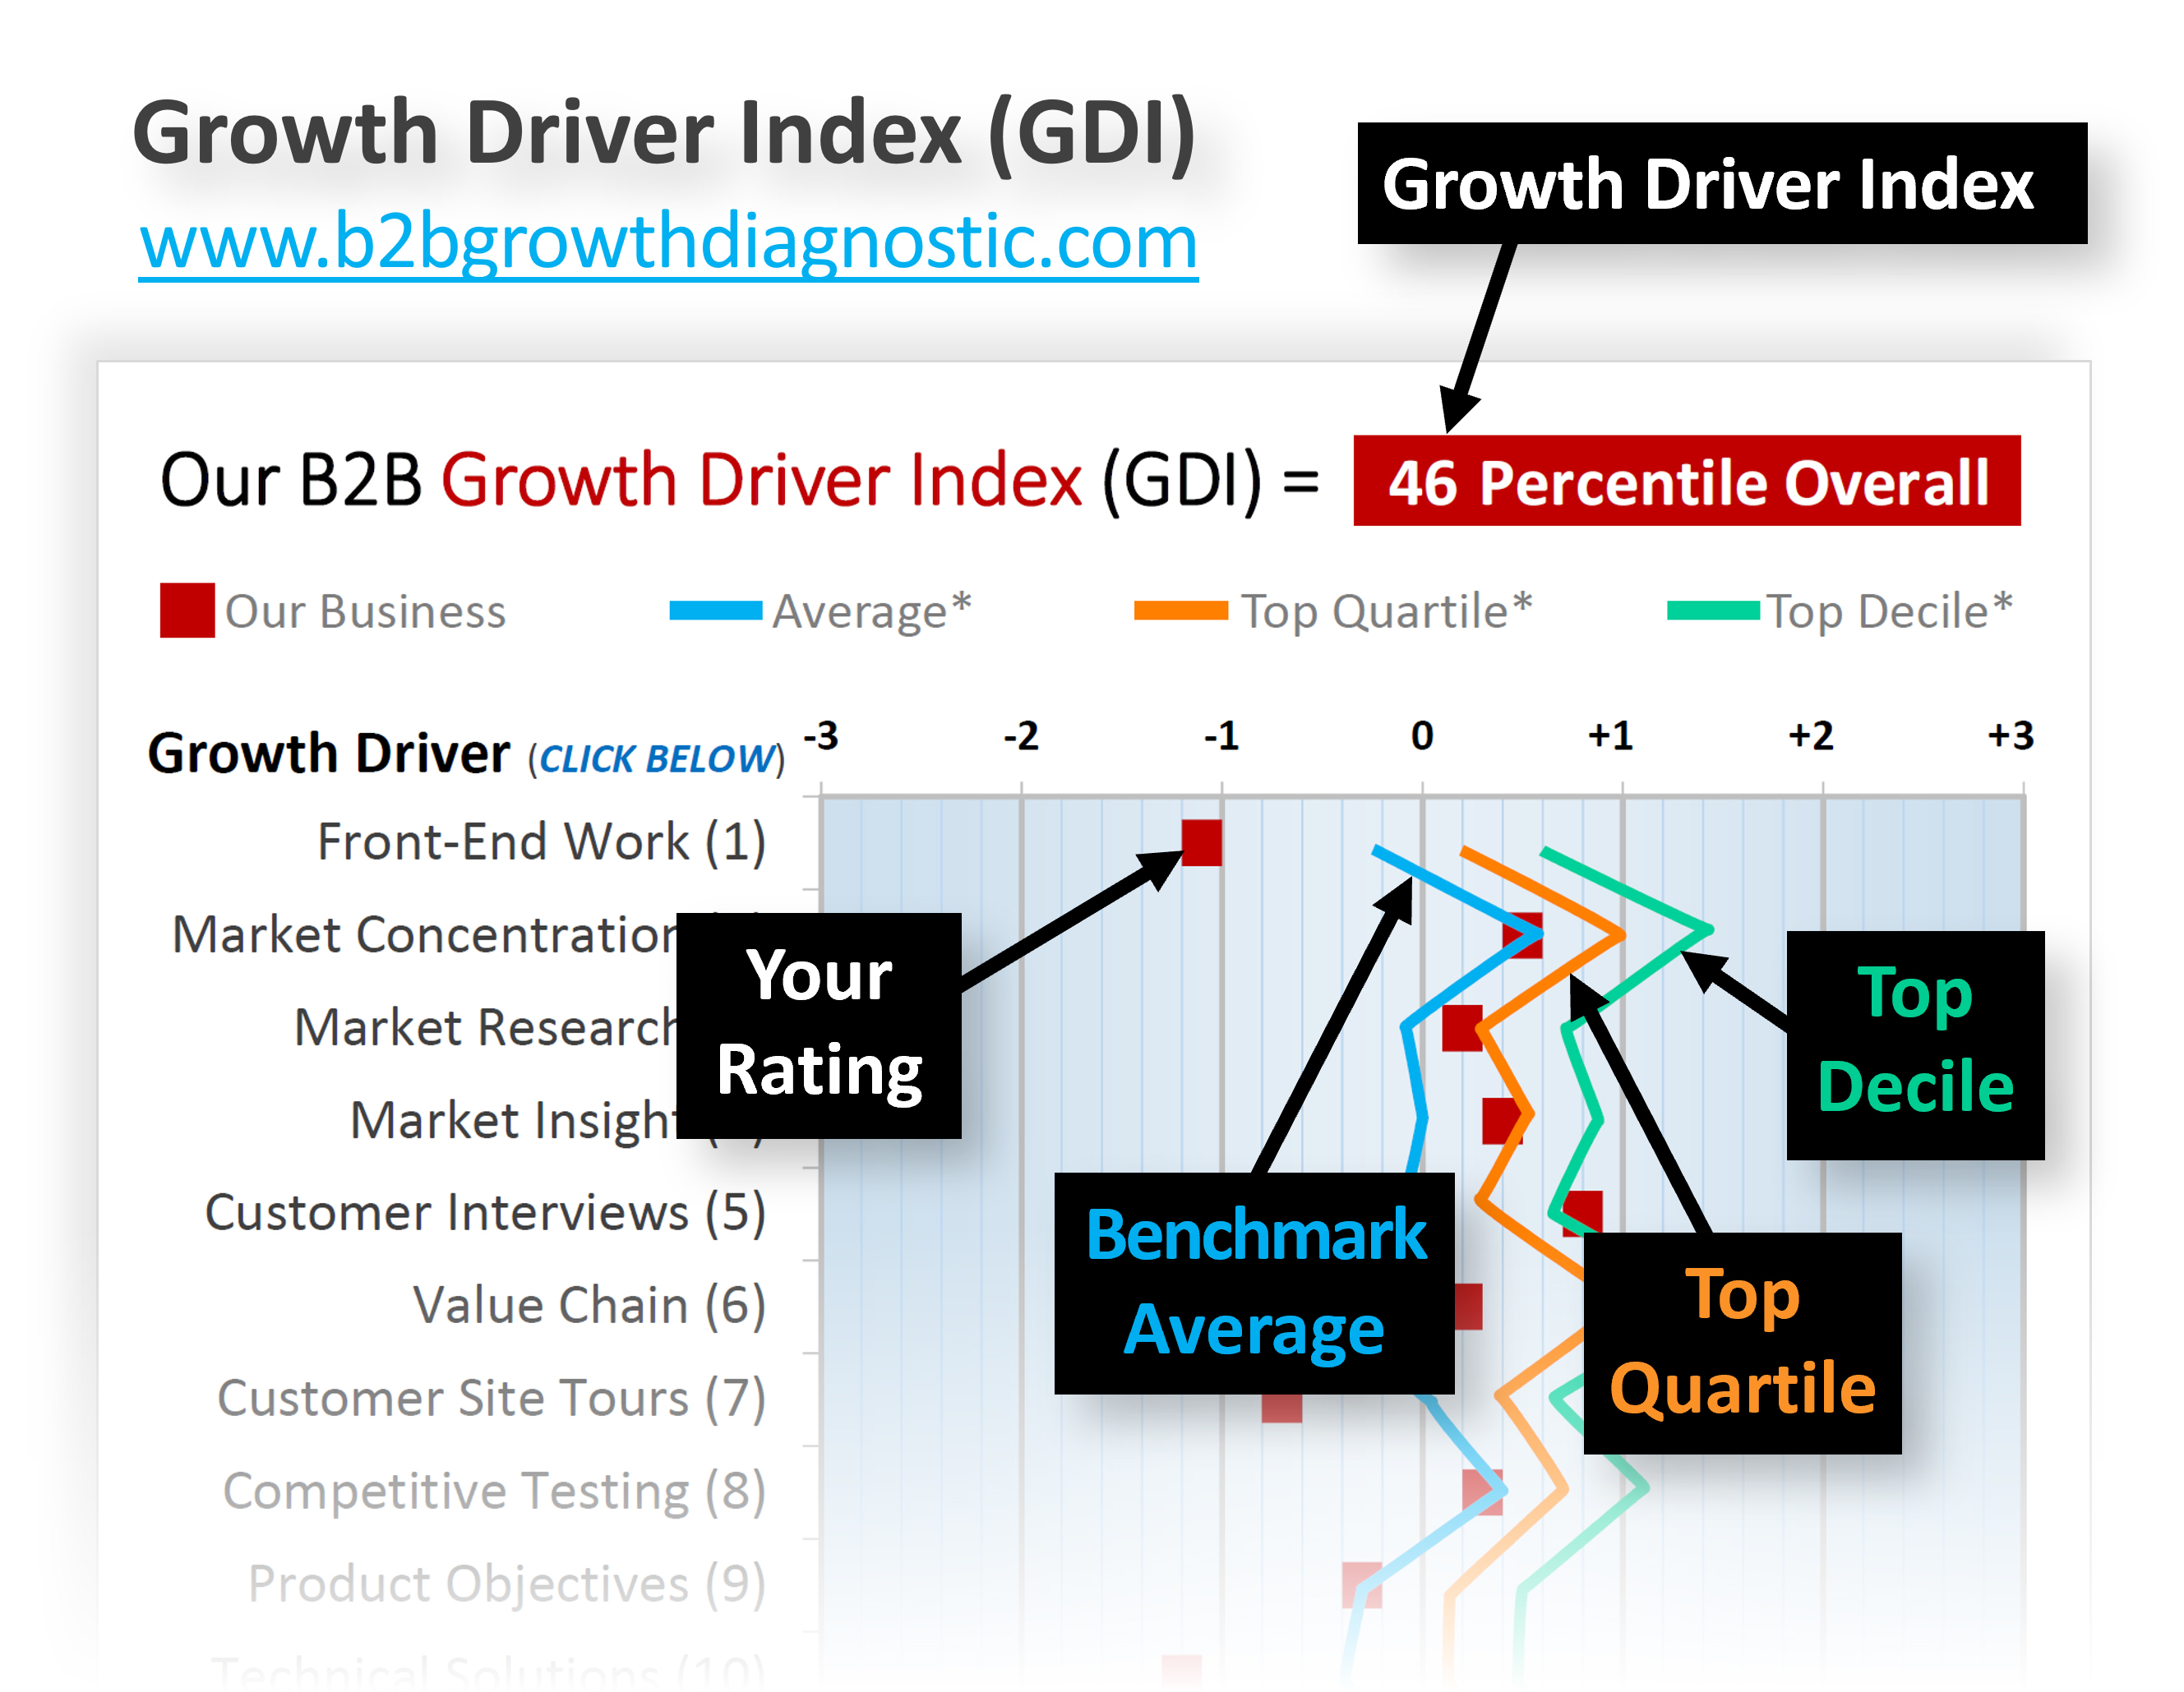
You’ll also see the ratings of average, top-quartile and top-decile businesses. Finally, you’ll see your average percentile placement against other companies for all 24 growth drivers. This is your Growth Driver Index (GDI)… one of the two new innovation metrics covered in this paper. This is the one that helps you build growth capabilities. Using our earlier analogy, this is the innovation metric for getting better between rugby matches.
This innovation metric has some advantages that might not be immediately evident:
- Effective: It satisfies all four of our earlier requirements for a good innovation metric: leading, actionable, benchmarkable and impactful.
- Insightful: You can use it alongside the research report mentioned earlier (www.whatdrivesb2borganicgrowth.com), since the same 24 growth drivers are studied. The research report tells you what most B2B professionals want to improve, and this diagnostic reveals your current proficiency in these capabilities.
- Simple: It’s easy to conduct. It takes an hour or two to set up—and just a few minutes per survey respondent—making it easy to repeat annually.
- Strategic: Your management team can use this to create a strategic growth capability plan… and update it with each strategic planning cycle.
- Accountability: Since employees complete a confidential survey, you’ll get their unfiltered judgment on how strong your growth capabilities are… critical for holding business leaders accountable for the future as well as the present.
The last point is important. The first duty of any business leader is, “leave your business stronger than you found it.” But we’ve all seen business leaders who prioritize short-term results to the point of degrading growth capabilities and sacrificing the future. The incentive for doing so comes from intense pressure to deliver near-term financial results… but also from the lure of near-term bonuses.
Why does a company enrich a business leader today who is working to impoverish the business tomorrow?
Perhaps the CEO has no way of detecting whether a VP is building or degrading growth capabilities in that VP’s division. And even if that CEO has suspicions, he or she lacks an objective means of measurement. Our accounting systems are certainly not designed to show this. This is why we need a new innovation metric.
Who knows exactly what is happening in that division? The employees. In some ways, this innovation metric is a “360 performance review” on business leaders. If the Growth Driver Index is dropping from year to year, the employees are reporting their leader is not on a trajectory to “leave the business stronger than they found it.” Make this innovation metric a component of your business leaders’ annual performance reviews and you’ll encourage better business stewardship.
4. A new innovation metric for achieving commercial confidence
While the last innovation metric helps your “rugby team” build capabilities between matches, this new metric promotes a game-winning discipline during each match. It reveals if your teams are following proven best practices for new-product success.
This innovation metric is called the Commercial Confidence Index (CCI), and it tells you how much of your R&D new-product development spending is aimed at “known” customer needs vs. “assumed” customer needs. Here’s why we focus on commercial confidence:
- The research cited earlier clearly shows B2B professionals are most eager to improve their ability to understand (vs. meet) customer needs… and this understanding is a strong differentiator between high- and low-value providers.
- Nearly five decades of research point to inadequate market understanding as the leading cause of new product failures.
- Because B2B customers have high knowledge, interest, objectivity and foresight, it is entirely possible to understand their needs before the development stage.
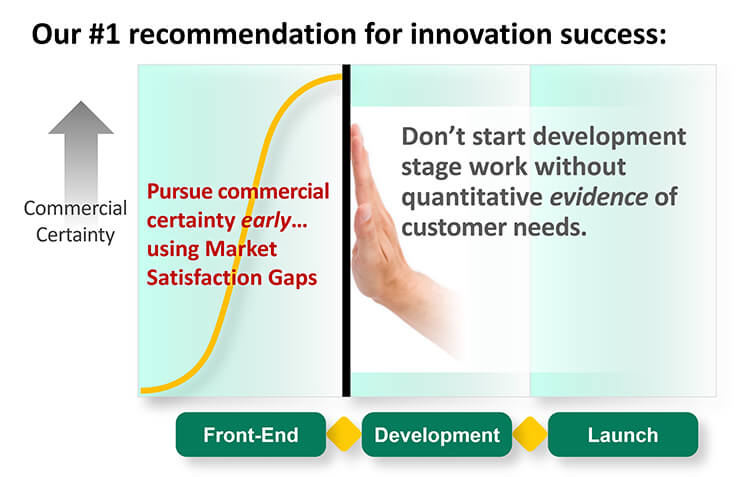
As shown below, most companies resolve their technical risk in the development stage… and their commercial risk during launch. They don’t know how the market will react to their new product until after they launch it. But B2B suppliers can build a “certainty time machine” and understand customer needs in the front-end. This lets you eliminate most commercial risk and deal just with technical risk during development.
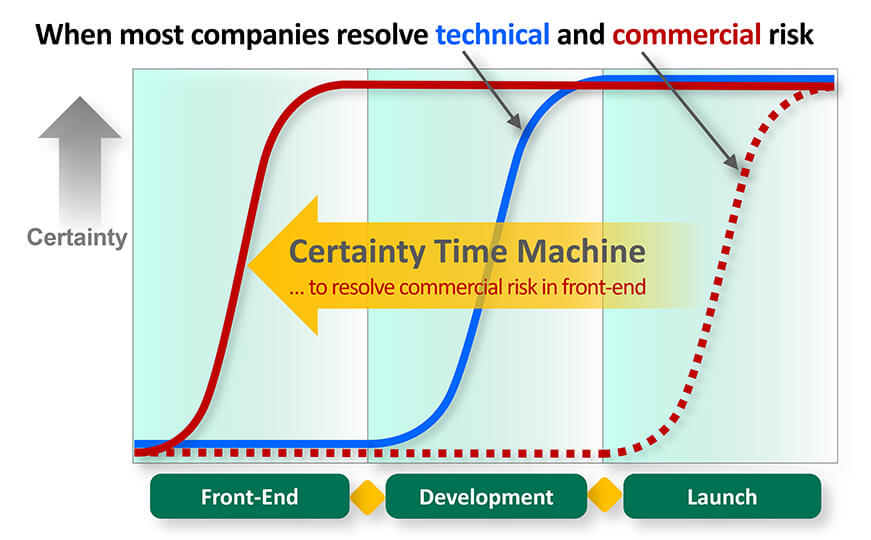
You get this commercial confidence by conducting two rounds of customer interviews… first divergent, qualitative Discovery and then convergent, quantitative Preference. If you were a packaging supplier, your Discovery interviews might uncover outcomes such as:
- Minimize the likelihood of box damage from moisture.
- Maximize the percent of recyclable content in new boxes.
- Minimize the frequency of crushed boxes due to vertical loading.
During Preference interviews, you’d then ask two questions for each outcome: a) How important is this outcome, and b) how satisfied are you today with your ability to achieve it? Digitally project your notes to engage customers. It looks like this using Blueprinter® software:
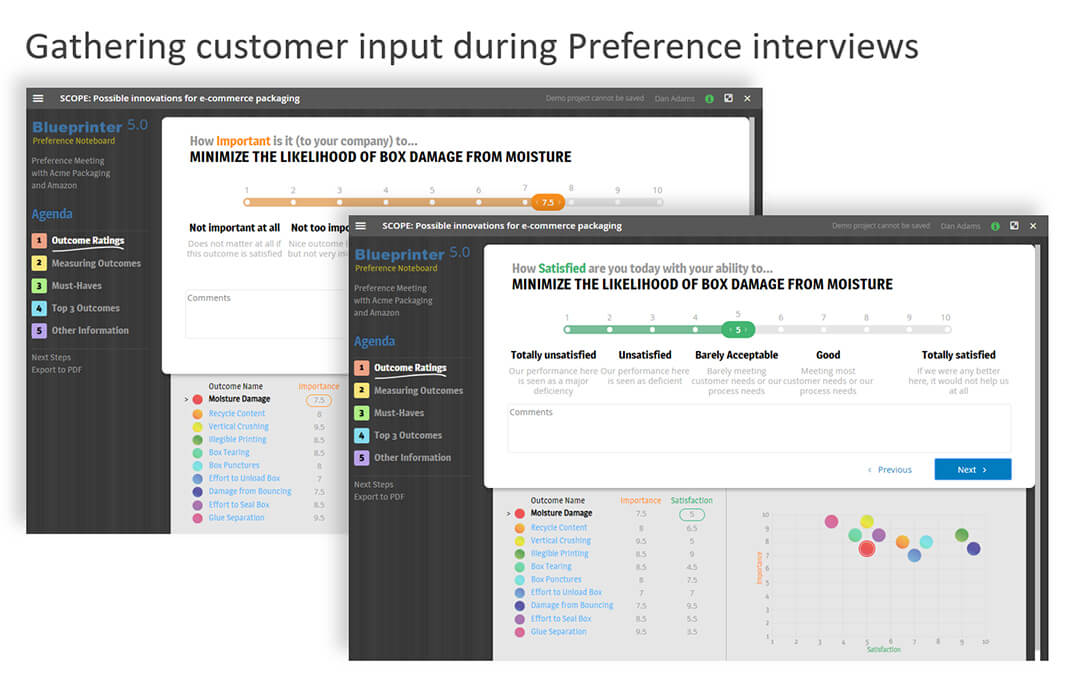
You then calculate Market Satisfaction Gaps for each outcome using this formula: Market Satisfaction Gap = Avg. Importance Rating x (10 – Avg. Satisfaction Rating). If the average market importance rating is “8” (IMP = 8) and the average satisfaction rating “6” (SAT = 6), your Market Satisfaction Gap for this outcome is 8 x (10 – 6) = 32%.
If an outcome scores a Gap of ~30% or more, you know the market is eager for improvement. These are the outcomes you should pursue. After all, the only way to get a price premium is to improve something important (high IMP rating) that needs improving (low SAT rating).
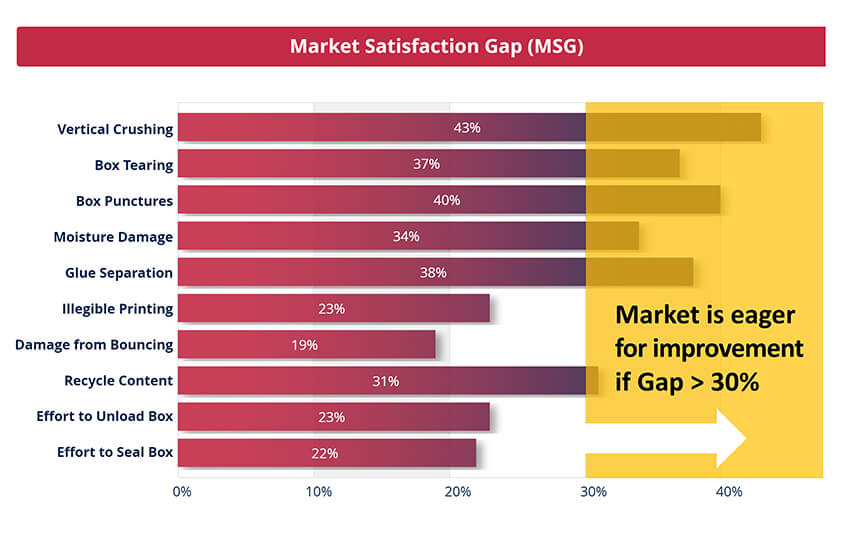
When you insist on Market Satisfaction Gaps, your project teams stop guessing…. stop incurring senseless commercial risk chasing outcomes customers don’t care about. They only work on outcomes that matter to customers. (For more, download a white paper at www.marketsatisfactiongaps.com.) Our new innovation metric will make it clear if teams have this insight.
Our number one recommendation for greater innovation success is this: Don’t start development stage work without unbiased, unfiltered quantitative evidence of customer needs like this. But consider two caveats. First, some product development projects are too small for this work. If you think the development stage will need at least one person-year of work, require a Market Satisfaction Gap chart.
Second, this applies to product development, not technology development. They are very different. Technology development is science-facing; product development is market-facing. Technology development turns money into knowledge; product development turns knowledge back into money.
If you’re working on technology capabilities that could be applied to many market segments, don’t build Market Satisfaction Gaps. But once you decide to deliver innovation to a single market, use Market Satisfaction Gaps to focus on what that market wants.
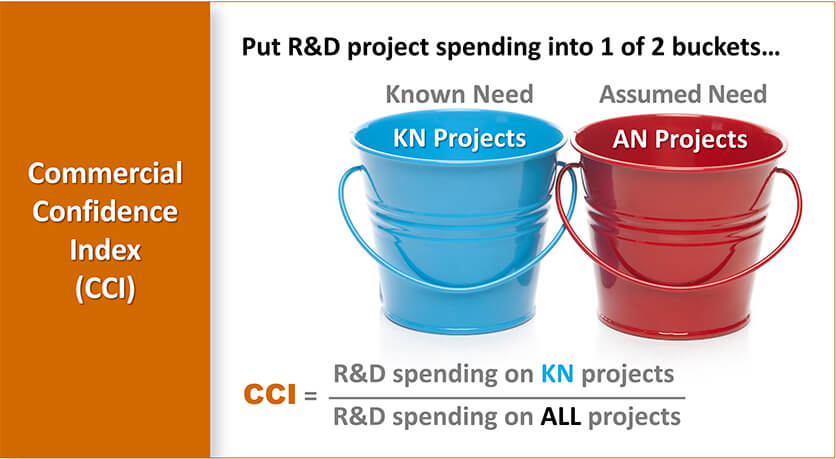
How do you institutionalize this discipline? That’s where our second innovation metric, the Commercial Confidence Index (CCI) comes in. Here’s how you calculate it:
- Step 1: Calculate your annual R&D spending for each significant product development project.
- Step 2: For each project, ask if you have quantified evidence of customer needs, e.g. Market Satisfaction Gaps. If “yes,” the project goes in the “Known Need” bucket. All other projects go in the “Assumed Need” bucket.
- Step 3: The CCI is your annual R&D spending on Known-Need projects divided by annual spending on all product development projects.
Be prepared for some push-back when you implement this new innovation metric across your organization. Can you imagine the conversations that might take place?
- Objection 1: “But I don’t know which projects should go in which bucket.”
- Response 1: “So we’re spending millions of R&D dollars, and don’t know which projects are based on real customer needs?”
- Objection 2: “All right, I did the calculations, but my CCI is zero.”
- Response 2: “Fine, but what is your CCI goal for next year, and the year after?”
Everything changes once teams understand this is the only way to enter the development stage.
Everything changes once teams understand this is the only way to enter the development stage. But can something as simple as using Market Satisfaction Gaps truly impact your growth? Here’s what practitioners said would happen if these methods were adopted across their company (See Preference Interview Research Report.):
- 98% said it would improve project success rate
- 96% said it would have a positive impact on organic growth
- 100% said it would lead to a more outside-in company culture
Here’s the blunt reason why these new innovation metrics will prove so powerful for your organization: They shine the light on two forms of innovation malpractice that are commonplace today:
- Most companies are way out of balance in their results-vs.-capabilities focus. The Growth Driver Index (GDI) will help your business gain a competitive advantage… by intentionally building growth capabilities year after year.
- Many companies ignore the rich B2B customer insights available to them prior to development. In the future, this obvious oversight will be a source of puzzlement. Today, the Commercial Confidence (CCI) shows how you are fixing this.
Implement both new innovation metrics and you’ll see your vitality index consistently move in the right direction. Even better, you’ll see rapid, profitable, sustainable growth. For the complete white paper on this topic, download New Innovation Metrics: Beyond the Vitality Index, at www.newinnovationmetrics.com.
Comments