Do your Stage-Gate® reviews separate Execution Quality & Opportunity Quality?

Even if your Stage-Gate® reviews are highly evolved, I’ll bet they’re missing a critical element: I doubt they separate your projects’ Execution Quality and Opportunity Quality. In this issue, we’ll see why this is holding you back. We’ll also look at a brand-new release of Blueprinter® software that remedies this.
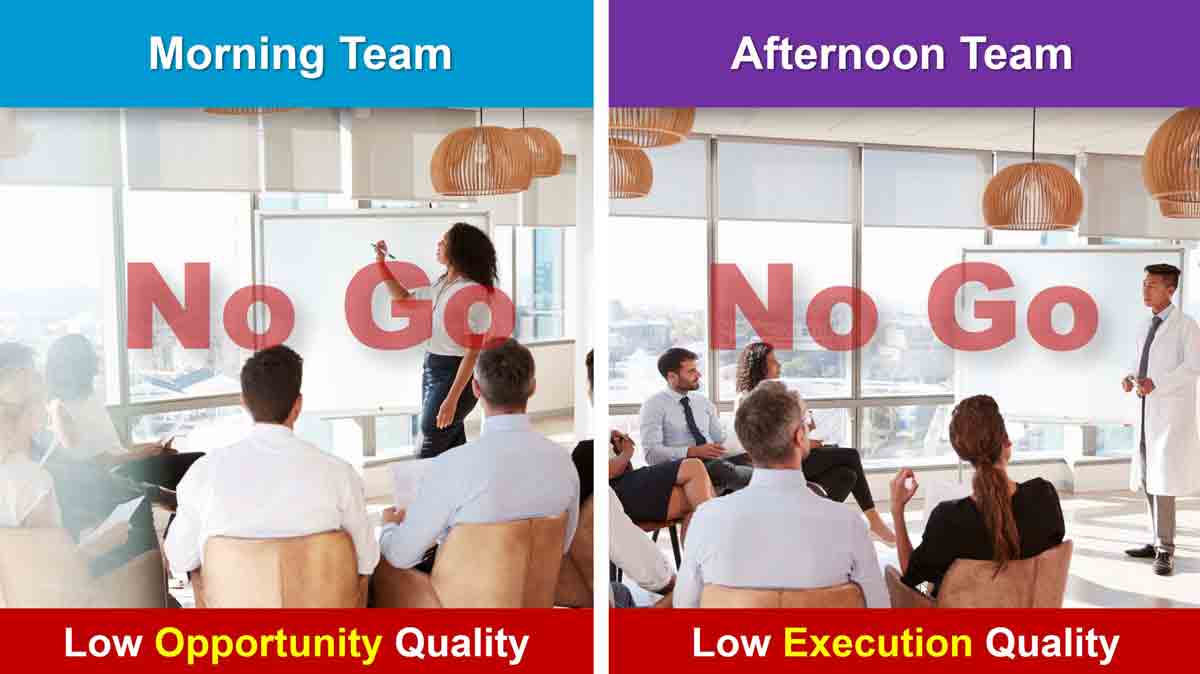
Imagine you’ve got two project teams holding their Stage-Gate reviews on the same day. Both teams get a “no-go” decision to proceed from the front-end stage into the development stage… but for very different reasons.
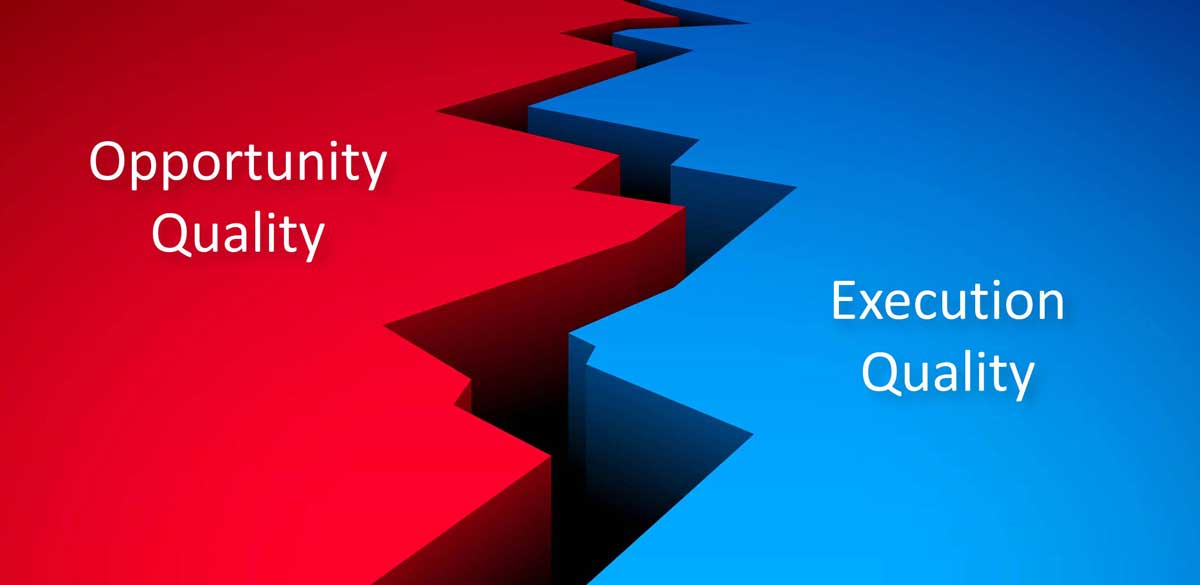
The reasons for these “no-go” Stage-Gate review decisions can be grouped into one of two categories: low-quality execution by the team, and low-quality opportunity in the project. You should understand—and even better, measure—your project teams’ levels of execution and opportunity.
Why? This is how your business gets better at new product development. This is especially true for Execution Quality. Without measuring this, your business is unlikely to see improved front-end work in future Stage-Gate reviews.

Two teams get a no-go decision…
The team in the morning Stage-gate review did a great job conducting qualitative, divergent Discovery interviews, followed by quantitative, convergent Preference interviews. As a result of the latter, they were able to calculate Market Satisfaction Gaps for many outcomes based on customers’ 1-to-10 importance and satisfaction ratings.
As it turned out, all the outcomes scored very low Gaps. In other words, the customers in this target market segment didn’t have any important-and-unsatisfied outcomes for the team to pursue. So the team rightfully recommends the project be halted during its Stage-Gate review. This team had good Execution Quality but poor Opportunity Quality.
The afternoon team gets a “no-go”, or “recycle” decision during its Stage-Gate review for very different reasons. They met with just a few customer contacts, and did a lackluster job of it:
- These were informal customer conversations with little probing depth.
- They only met with friendly contacts at their existing customers.
- They didn’t interview customers’ customers, where the real action takes place in this market.
- They conducted no quantitative Preference interviews at all.
- They let their project drag out for a very long time.
This team may have had good Opportunity Quality: It’s hard to say based on the lax workmanship revealed during their Stage-Gate review. But it’s certain they had poor Execution Quality.
Would your Stage-Gate reviews treat these two teams differently? They should. The morning team should be congratulated and rewarded with the next important new project. The afternoon team should be trained.

Measuring Opportunity and Execution Quality
The best time to measure Opportunity Quality (OQ) and Execution Quality (EQ) is at the “money gate” in your Stage-Gate reviews. This is the critical gate between the front-end of innovation and the beginning of the costly development stage.
My golden rule of investment is, “Make your decisions when you have gained the most insight and spent the least amount of money.” Obviously, these objectives are in tension, but—done well—the front end provides a treasure-trove of inexpensive insight that nearly eliminates B2B commercial risk. That’s why I think the most important Stage-Gate review is the one that completes the front-end stage.
Make your investment decisions when you have gained the most insight and spent the least amount of money.
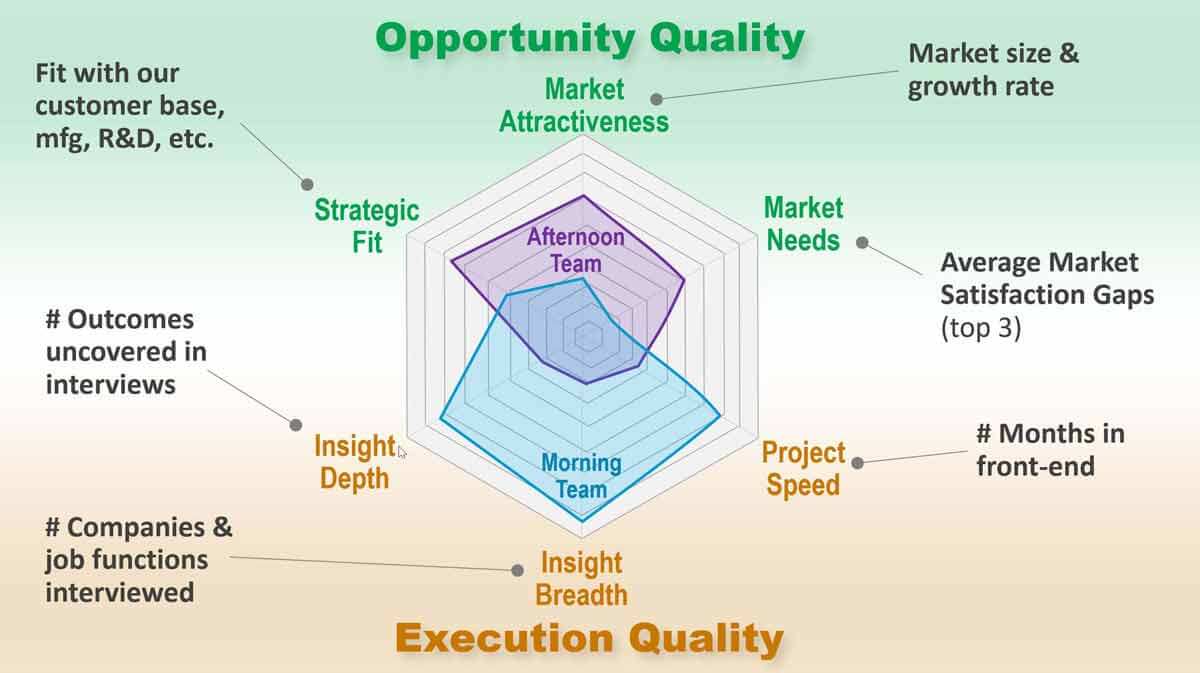
The following illustration shows the key metrics for measuring Opportunity Quality and Execution Quality at this point in your Stage-Gate reviews:
- Strategic Fit (OQ): Fit with our customer base, manufacturing, R&D, sales reach, etc.
- Market Attractiveness (OQ): Addressable market size, market growth, competitor strength.
- Market Needs (OQ): Average Market Satisfaction Gap for highest 3 outcomes.
- Insight Depth (EQ): Total # of outcomes found in interviews, probing word count.
- Insight Breadth (EQ): # of companies, job types, value chain levels interviewed.
- Project Speed (EQ): # of months from project start to business case (how current are needs?)

Using these new metrics, management can quickly assess Opportunity Quality and Execution Quality during Stage-Gate reviews. They know a) which teams to move forward in the Stage-Gate process (high Execution quality and high Opportunity quality), b) which should be killed (low Opportunity Quality), and c) which need to be recycled for more work (low Execution Quality).
Most companies measure Opportunity Quality during Stage-Gate reviews, even if they don’t call it that. But hardly any companies measure Execution Quality. When you shine the light on Execution Quality metrics, you encourage continuous process improvement in your Stage-Gate process.
Let’s say it another way: If you’re not measuring Execution Quality, how can you expect to get better? Are your teams failing to probe deeply? Do they only interview friendly customers? Are they skipping unbiased, quantitative interviews?
These behaviors are unlikely to change if nobody notices. But behaviors change when you measure Execution Quality, so that future Stage-Gate reviews will deliver much richer insight for good decision-making.
“You can’t manage what you can’t measure.” – Peter Drucker
Blueprinter® now measures EQ and OQ
New metrics can be helpful, but they often require extra work to gather the data. Turns out, though, if you are using Blueprinter software, the relevant data is already being gathered. Just think of all the work you do that the software captures on a real-time basis:
- How deeply you probed in Discovery interviews, based on the average word count in your sticky notes.
- How broadly you probed, based on the total number of outcomes uncovered during Discovery interviews.
- How thoroughly you explored the market segment, based on the number of companies and job functions interviewed.
- How eager the market is for improvement, based on outcome Market Satisfaction Gaps from Preference interviews.
- The total addressable market size and growth rate as recorded in your Market Case.
These and many more data points are measures of your project team’s Execution Quality and Opportunity Quality. In fact, every single relevant metric has already been captured without anyone needed to make a single extra keystroke. You’ve got everything you need for your Stage-Gate reviews.
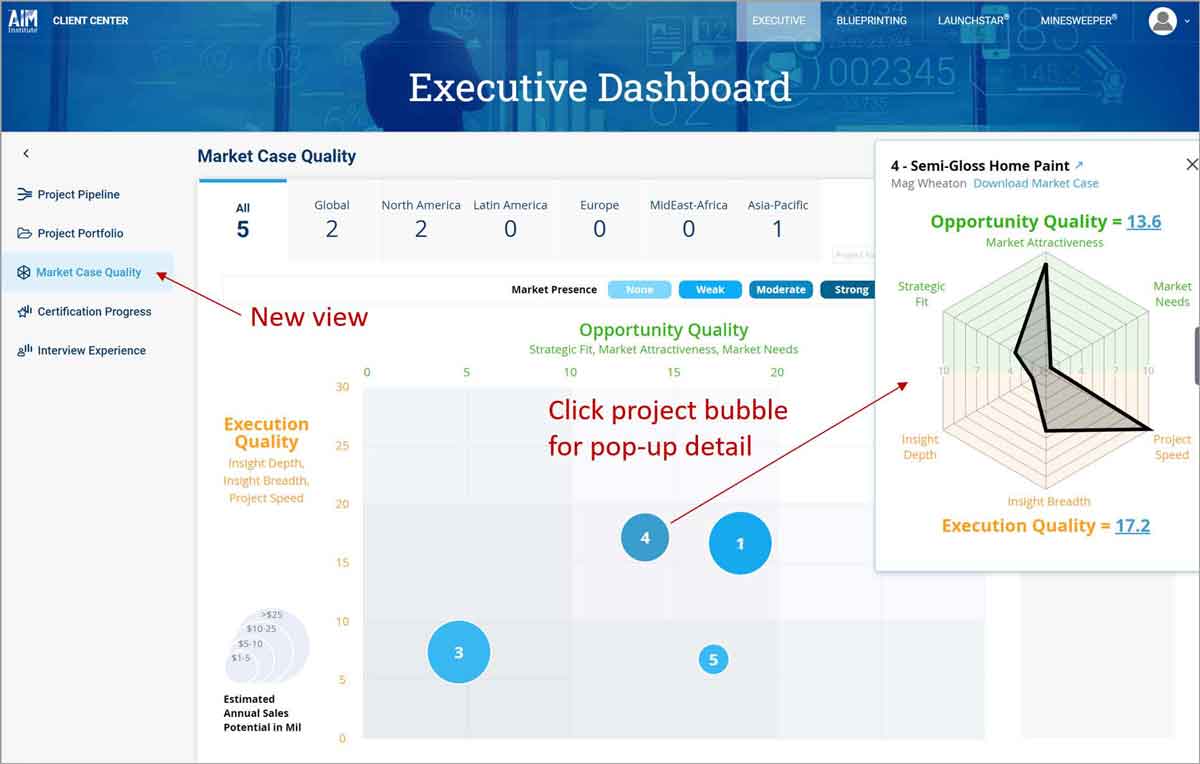
But how do you “extract” this insight from Blueprinter software? This is done at the portfolio—not single project—level in your company’s Executive Dashboard. (The AIM Institute offers this as a free service to its clients. Contact us to learn more.)
As shown below, a new view called Market Case Quality has been added to the other four Executive Dashboard views. It’s called this because the Market Case—an abbreviated business case—is typically presented during the “money gate” prior to development in your Stage-Gate reviews. This is precisely when opportunity and execution insights are most valuable.

Learning more…
In one form or another, you already gather Opportunity Quality data on NPD projects to make your Stage-Gate review decisions. But you can take your decision-making to the next level by also incorporating Execution Quality data. Even better, this will allow you to get better at new product development.
If your company uses New Product Blueprinting, but isn’t taking advantage of the Execution Dashboard, contact us and we’ll set it up at no cost.
If New Product Blueprinting is unfamiliar to you, learn more by visiting www.newproductblueprinting.com. You’ll see how we train B2B professionals in B2B-optimized voice of customer skills at www.blueprintingtraining.com.
Stage-Gate® is a registered trademark of Stage-Gate® International
Comments